3W iCandle Review
General Information
| ID | #179 |
|---|---|
| SKU | N/A |
| Series | N/A |
| Manufacturer | iGlobe (other LEDs from iGlobe) |
| Fitting Type | E14 (other E14 LEDs) |
| Light Type | Globe |
| Height | 120mm |
| Width | 36mm |
| Weight | 30g |
| Warranty | 5 Years |
| Test Date | 2013-07-31 |
| Review Notes | Interesting looking globe. Claimed to have same output as 40W incandescent. But in our opinion it is closer to 15W. Somewhat uneven light distribution. Some sensitive people might notice 100Hz flicker. Dimming was rather poor (but might be better with more globes in circuit). Efficiency and CRI are reasonable. |
| Price | $13.99 (AUD) from iGlobe on 30th of July 2013 |
| Rating |    |
|---|
LED Specifications
| Claimed | Measured |
Compared To |
|
|---|---|---|---|
| Watts | 3W | 2.4W @ 246V | 41.1W @ 246V |
| Yearly Running Cost[?] | $0.66 | $0.53 | $9.00 |
| Lumens | 240 lm | 141 lm | 430 lm |
| Efficiency[?] | 80 lm/W | 59 lm/W | 10 lm/W |
| Lumens/Purchase Price | 17 lm/$ | 10 lm/$ | 215 lm/$ |
| Power Factor[?] | N/A | 0.93 | 1 |
| Color [?] | Warm White, 2900K | Warm White, 2921K | Warm White, 2649K |
| Angle[?] | Omni-Directional | 261° | 292° |
| Dimmable | Yes, Leading or Trailing Edge | Below average | Yes, Leading or Trailing Edge |
| CRI (Color Accuracy)[?] | N/A | 81 | |
| Life | 50,000 hours | Not Measured | 1,000 hours |
| Min/Max Voltage | 220V / 240V | 240V / 240V | |
| Min/Max Temperature | N/A / N/A | N/A | |
| Measured Temperature | 67°C @ 25°C ambient 153°F @ 77°F ambient |
134°C @ 25°C ambient 273°F @ 77°F ambient |
|
| Flicker Percent[?] | 93% | 15% | |
| Flicker Index[?] | 0.178 | 0.044 |
Link to manufacturer specifications at time of testing
Dimming measurements
Graph notes: Dimming performance can be highly dependant on the type of dimmer, the number of lights in the circuit and other factors. Results in your house might vary. Mouse over the graph for more details. Position 10 = Not dimmed. Position 1 = Fully dimmed.
Advertisement
Distribution Graph
Angle: 261° (±130.5° from bottom), Maximum lux:
Graph notes: Shows the intensity of the light when viewed from different angles. Normal omni-directional globes have a fairly constant output all the way around (excepting directly above). Downlights have a narrow range at the bottom in which the light is emmited, this determines their angle.
Spectrum Graph

Graph notes: Shows the breakdown of the LED light into its component colors. With short wavelength ultraviolet on the left and long wavelength infrared on the right. The green line represents the relative absolute strength of the light at each frequency, while the red line represents what the typical human eye would see. The human eye is most sensitive to green light, but much less sensitive to purples and deep reds.
Flicker Graph
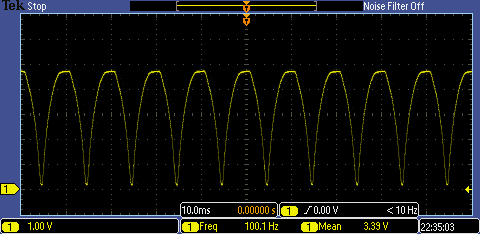
Percent: 93%, Index: 0.178 (lower is better in both cases)
Graph notes: Shows variation in light output over 1/10th of a second, with relative light output on the Y axis and time on the X Axis. Measured with a photodiode connected to an Oscilloscope. Ideally the yellow line should be flat. Low frequency high amplitude waveforms mean there is a possibility of noticeable flicker, but sensitivity to flicker varies between people. [More details about LED flicker]
Disclaimer: While every effort has been made to ensure the accuracy of these results, each measurement carries an inherent degree of uncertainty and error. Safety and EMC compliance of products to regional or international standards have not been verified unless noted as an ENERGY STAR® LED Lighting Facts, or SSL Quality Scheme certified product. Retailers and importers selling unmarked or unapproved electrical goods can be fined or imprisoned. Mains supplied downlights require installation by a licensed electrician.